Building "My Local Grocer"

This is a side project that I've been picking away at on-and-off for the past few years, and I'm finally at a place where I can say I'm "done".
My Local Grocer was my attempt to make small mom-and-pop grocers more visible to folks within Toronto. As I continued working on it, I expanded the scope further to include chains that are local to the city.
If you live or have lived in Canada, you probably immediately know what I mean when I say that searching for local mom-and-pop grocery stores can be a challenge. And if you live in a small town, you may not have any options besides the one store that's part of a major supermarket chain.
For those who haven't been in Canada for an extended period of time - it has a number of significant industries under the control of a small number of companies - grocers, telecoms, and banks to name the ones that Canadians talk about the most.
In Ontario (the province where I live), a significant number of grocery stores are likely owned by one of the following companies:
- Loblaws
- Empire
- Metro
There are other companies that also sell groceries, such as M&M Meats and Giant Tiger, but they aren't as widespread as the stores owned by the above three.
Loblaws, in particular, has gained a lot of ire - they've been at the heart of a few scandals such as price-fixing and overcharging customers by underweighing meat. It's gotten to the point where there is an entire subreddit that was organizing boycott efforts against their stores.
As part of that boycott, I attempted to find alternative grocery stores by searching on the web for "independent grocers".
And you know what I found?
A grocery store chain conveniently named "Your Independent Grocer".
And you know who owns that grocery store chain?
Loblaws. That's who.
And the fact that this is a thing irked me enough that it drove me to search for ways of finding actual independent grocers within Toronto.
So how did I do this?
Step 1: Getting the data
The City of Toronto has a decent amount of data that it makes available via their Open Data Portal. In it, there's a CSV dataset that's updated daily that contains a list of business licenses and permits that have been issued across the city.
Every business that sells food is required to have a specific retail licence for food, so I focused on that. However, this still covers a lot of different types of stores.
Any store that offers food, which can include places like gas stations, would need this type of license. As part of this project, I had to figure out a way to clean/organize the data to narrow down the final list.
Step 2: Cleaning/parsing the data
After getting the CSV, the main challenge I had was making a call on what was considered a "chain" vs. an "independent" grocer.
Did I exclude all grocers that had more than a certain number of locations in the city? Or did I want to choose to only highlight "mom-and-pop" stores with a single location?
I ultimately made the call to retain grocers that I understood to be local chains, and to include general stores that offered a sizable pantry/grocery section (although not corner stores because they tend to be more of an "odds-and-ends" store).
I acknowledge that my filtering of the dataset isn't perfect, but I made a solid attempt to ensure that the major stores in the city were included in the processed dataset.
Once I had processed the dataset, I stored the information in a Postgres database (using Supabase) so that I could later leverage postgis (a plugin that makes it easier to work with geospatial data) to get all the locations that were within a certain kilometer radius of the user (more on that later).
The last part I needed to do to get the data ready was to get the coordinates of each location. I leveraged Mapbox's Geocoding API to get the latitude and longitude coordinates for each location in the database, before I was ready to start presenting this data on a map.
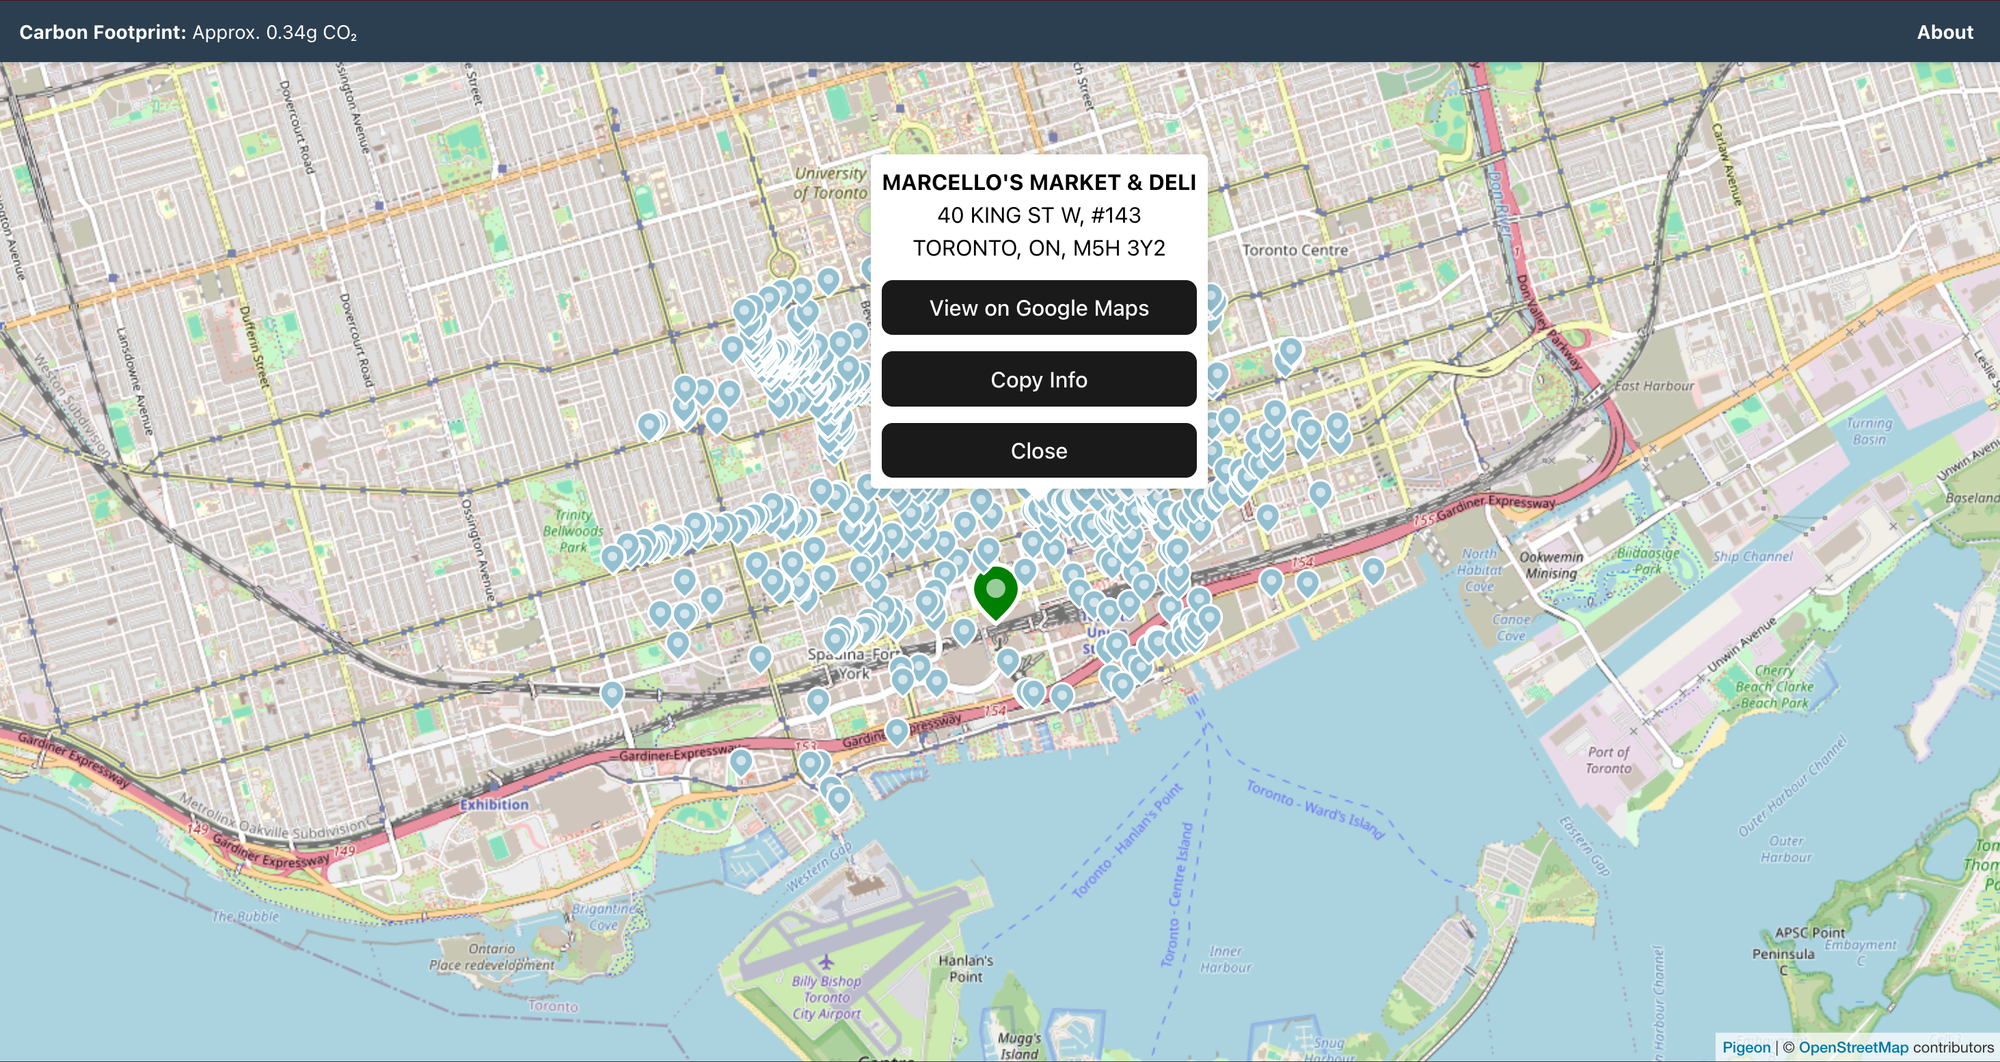
Step 3: Presenting the data
A former colleague of mine suggested Pigeon Maps to render location pins of the different stores. It's a light-weight, open source package, which is all I really needed for this project.
Once I got a map to render, I used either the user's location (retrieved via the Geolocation API on the browser) or a default of the coordinates of the CN Tower if the user didn't wish to provide their location.
Highlights of the project
Coding with AI was actually kind of fun
When I started this project, AI wasn't the talk of the town the way that it is today. About halfway in, I wanted to try out Cursor and see how developing software with it felt.
I didn't want it to build the whole project for me, but I wanted it to help me refresh and further develop my skills with the Go programming language, which I felt it did help me with.
Additionally, as long as I asked follow-up questions about what it was suggesting (and to also verify using good ol' Google), I felt like I was learning faster than I would have without it.
Last, the AI agent helped me get past annoying hurdles so that building the project was more fun than it's been in the past. One of my biggest challenges with side projects at times is getting frustrated and bored when I end up fighting with the tooling rather than working on the problem I want to be working on. Because of this help, I actually saw this project through to the end.
Got to try out a bunch of new libraries and tools
The following is a list of things I got to try out that were completely new to me:
I particularly liked testcontainers for its ability to easily spin up containerized test databases and see myself using it again in a future project.
Learned a bunch of new things
Besides getting some more practice writing in Go, I learned:
- How to use postgis (and to be aware that postgis coordinates are stored as "longitude/latitude" instead of "latitude/longitude")
- I didn't end up needing to use it, but I learned how to essentially have a Jaccard Similarity check in a database query
- How to make an approximate calculation of the carbon emissions based on the transfer size of the response data (something I've been curious about exploring further, see this library)
- This calculation also incorporated:
- The carbon intensity of the electricity grid (used the value for Ontario)
- The carbon intensity of the data centre where the application was theoretically hosted (I had chosen the GCP Montreal region for its extremely low carbon footprint).
Challenges of the project
Supabase/postgis and testcontainers were difficult to get working together
I'm hoping it's just because I missed some configuration or other setup, but one of the biggest pain points while building this was that the use of Supabase with postgis alongside testcontainers was strangely difficult.
More specifically, I had to keep commenting and uncommenting SQL statements to include or remove the "postgis.<datatype>" in my SQL queries depending on if I was testing "production" or if I was running my integration tests. If I didn't, I'd run into errors.
I poked at this for a bit, but ultimately didn't get to a working solution.
The City of Toronto changed their CSV format in the middle of the project
This ultimately led to me deciding it was time to wrap up and move on from the project, as it became very difficult to get the list I wanted without a lot more manual work.
The new licensing scheme divided licenses for selling food into 2 categories: "Eating or Drinking Establishment" and "Take-out or Retail Establishment". The former is for businesses where food or drinks are prepared on-site for immediate consumption and may have take-out service, the latter is where food or drinks are prepared for consumption off-site.
This made it much harder to determine what was a grocery store because they grouped any business establishment that sold food for take-away together, mixing grocers up with a large number of restaurants.
The dataset also appeared to have removed small details that I was using to make distinctions between different types of businesses.
For instance, the information that Cob's is a bakery in that "Bake Shop" appeared in the data is now lost in the new format.
There was also a small change in the "endorsements" section of the CSV - "refreshments" was changed to "eating/drinking". I had been using "refreshments" to filter out coffee shops which frequently had this, so once this changed, I needed to adjust the parser accordingly.
As an example of the before/after of the data:
- Before:
27167,RETAIL STORE (FOOD),B50-4544000,GALAXY FRESH FOODMART,2015-11-27,2483961 ONTARIO INC,4167788868,,587-591 GERRARD ST E,"TORONTO, ON",M4M 1Y2,NO SEATING ACCOMMODATION;,"""CONFIRMED ADDRESS: 587 GERRARD ST EAST""","""SUBJECT TO ZONING BY-LAWS # 1156-10 AND 438-86""",,REFRESHMENTS;,,2023-10-03 - After:
26707,TAKE-OUT OR RETAIL FOOD ESTABLISHMENT,B50-4544000,GALAXY FRESH FOODMART,2015-11-27,2483961 ONTARIO INC,4167788868,,587-591 GERRARD ST E,"TORONTO, ON",M4M 1Y2,14,NO SEATING ACCOMMODATION;,"""CONFIRMED ADDRESS: 587 GERRARD ST EAST""","""SUBJECT TO ZONING BY-LAWS # 1156-10 AND 438-86""",,EATING/DRINKING;,,2024-12-31 - Before:
27162,RETAIL STORE (FOOD),B50-4543756,COBS BREAD,2015-12-09,KNEAD DOUGH TOO INC,6479903167,,156 DANFORTH AVE,"TORONTO, ON",M4K 1N1,NO SEATING ACCOMMODATION;,,,,BAKE SHOP;,,2023-10-17 - After:
26703,TAKE-OUT OR RETAIL FOOD ESTABLISHMENT,B50-4543756,COBS BREAD,2015-12-09,KNEAD DOUGH TOO INC,6479903167,,156 DANFORTH AVE,"TORONTO, ON",M4K 1N1,14,NO SEATING ACCOMMODATION;,,,,EATING/DRINKING;,,2024-12-31
Next steps
As mentioned above, the plan is to shelve the project for now as I've taken this as far as I'm willing to go due to the amount of manual work required to make the processed data more accurate.
I had hoped that I'd get it to a point where every major city in Canada could have this available, but after a couple of years of chipping away at this, there are other projects I'm hoping to work on.

Erica Pisani Newsletter
Join the newsletter to receive the latest updates in your inbox.

